Getting started
Last updated: August 24, 2026
This feature is available to Enterprise customers with at least 10 Agent runs. Not on an Enterprise plan yet? Request a demo to see what's possible.
Step 1: Navigate to Command Center
Go to Settings in the settings icon menu at the bottom left of the platform.
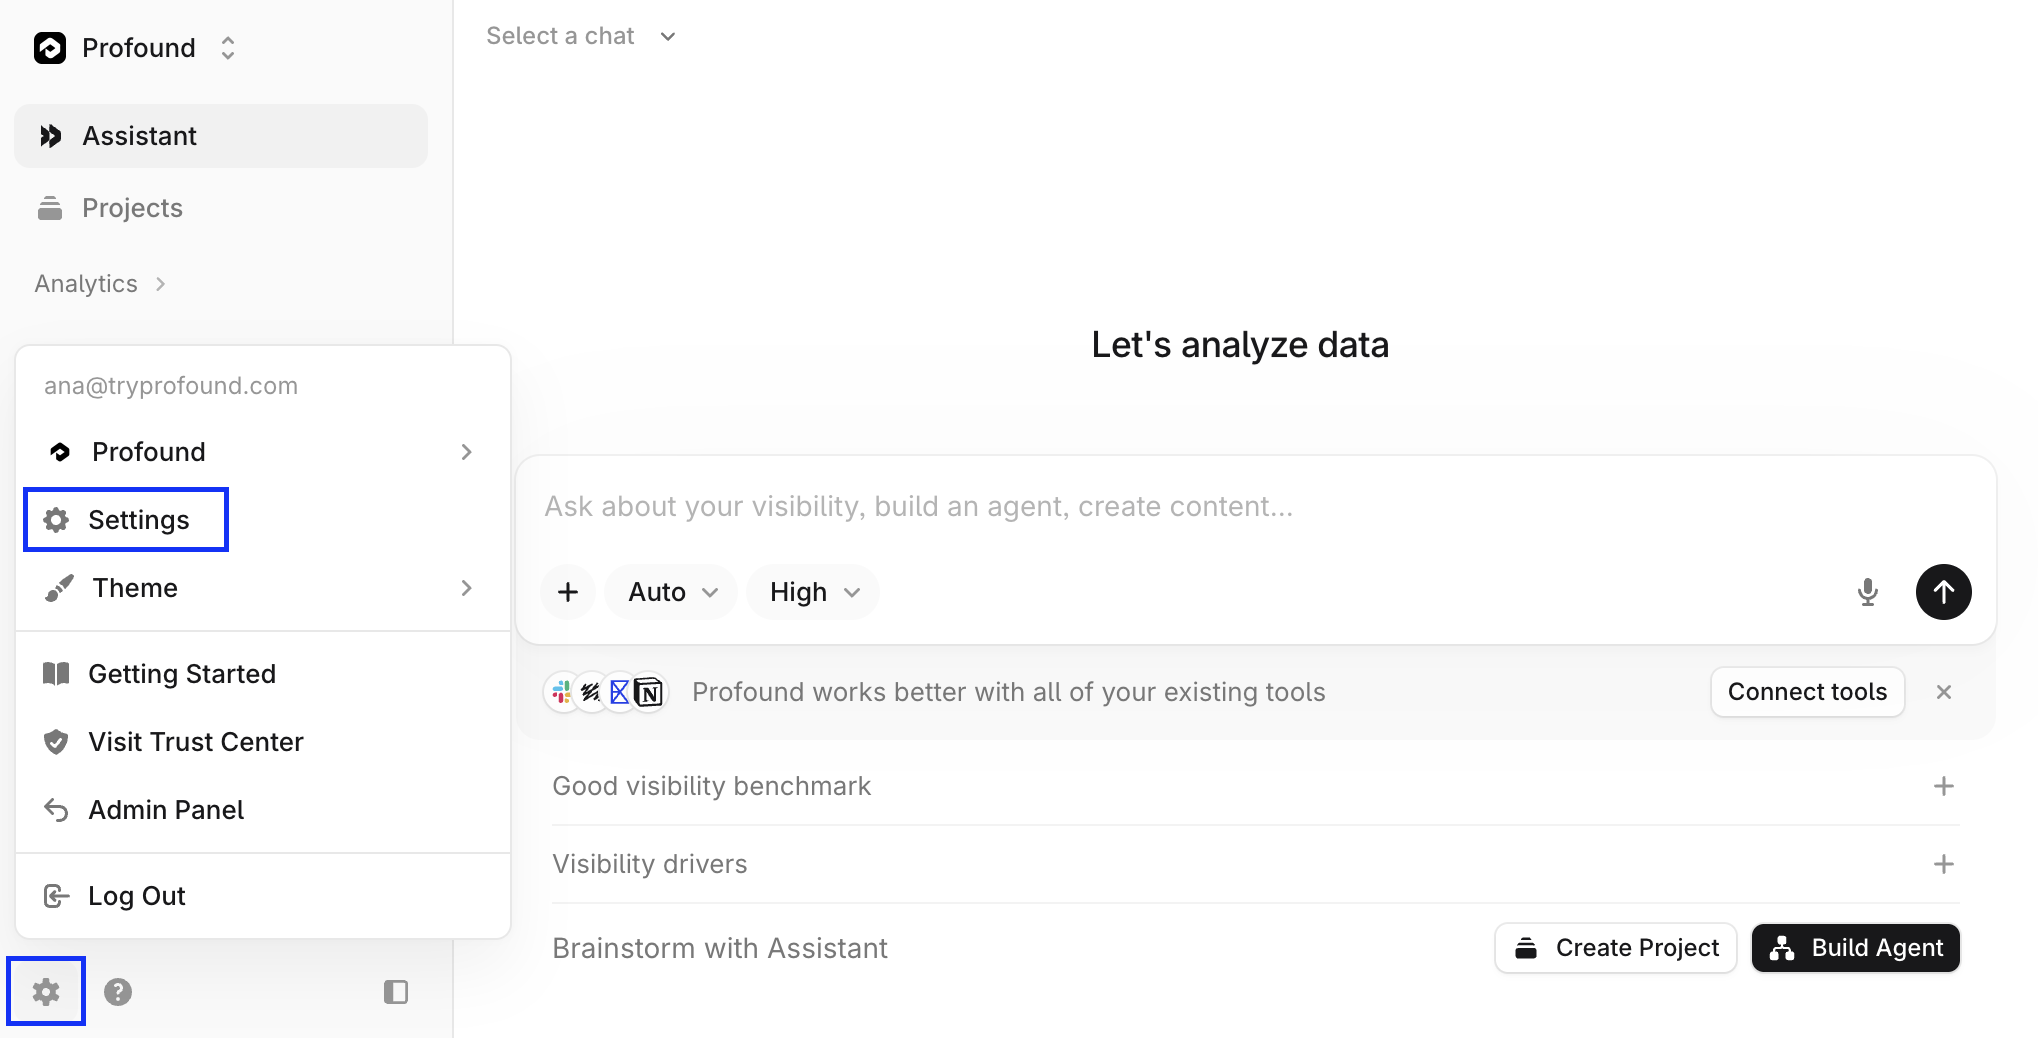
Select Command Center under Organization in the left navigation sidebar.
Step 2: Review your team’s usage
Scan your Overall Performance graphs: Active Users, Agent Runs, Total Hours Saved, and Projects Tracked.
Then check the Platform Usage metrics: Power Users leaderboard and Agent Usage by Category.
Use the View filter to switch between Total (metrics for all time) and Time Frame (metrics for the set time frame).
Step 3: Customize your average process time values
Select Expand on the Total Hours Saved card.
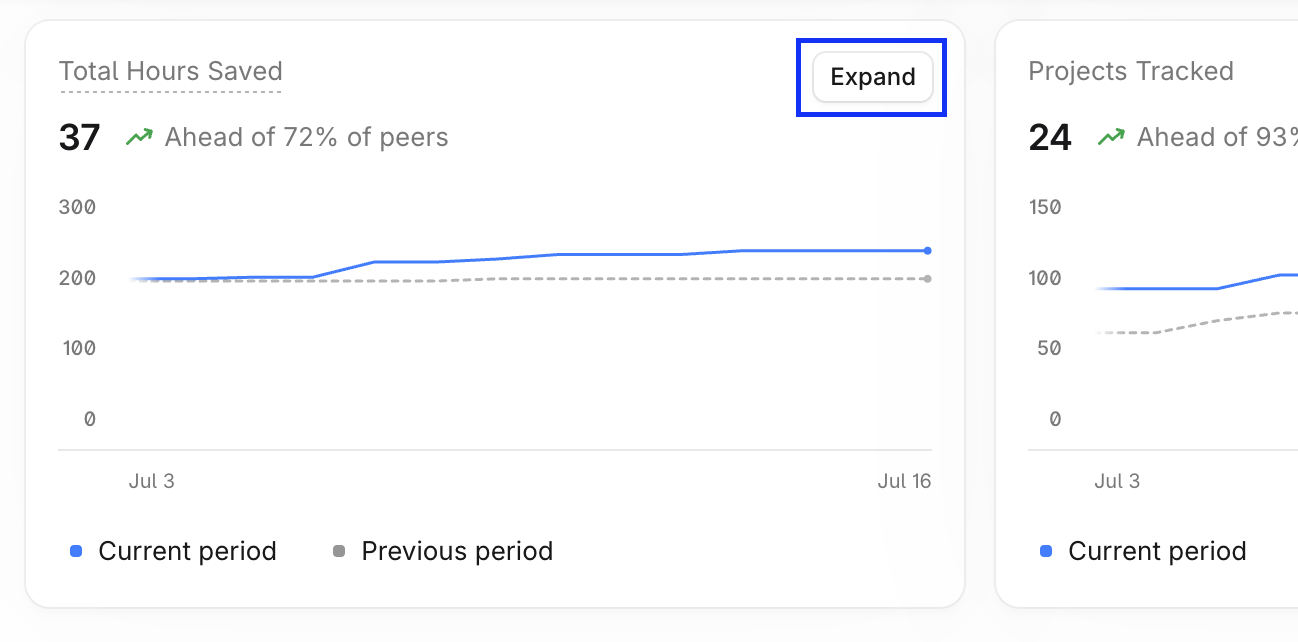
select Edit Average Process Time in the Total Hours Saved Breakdown.
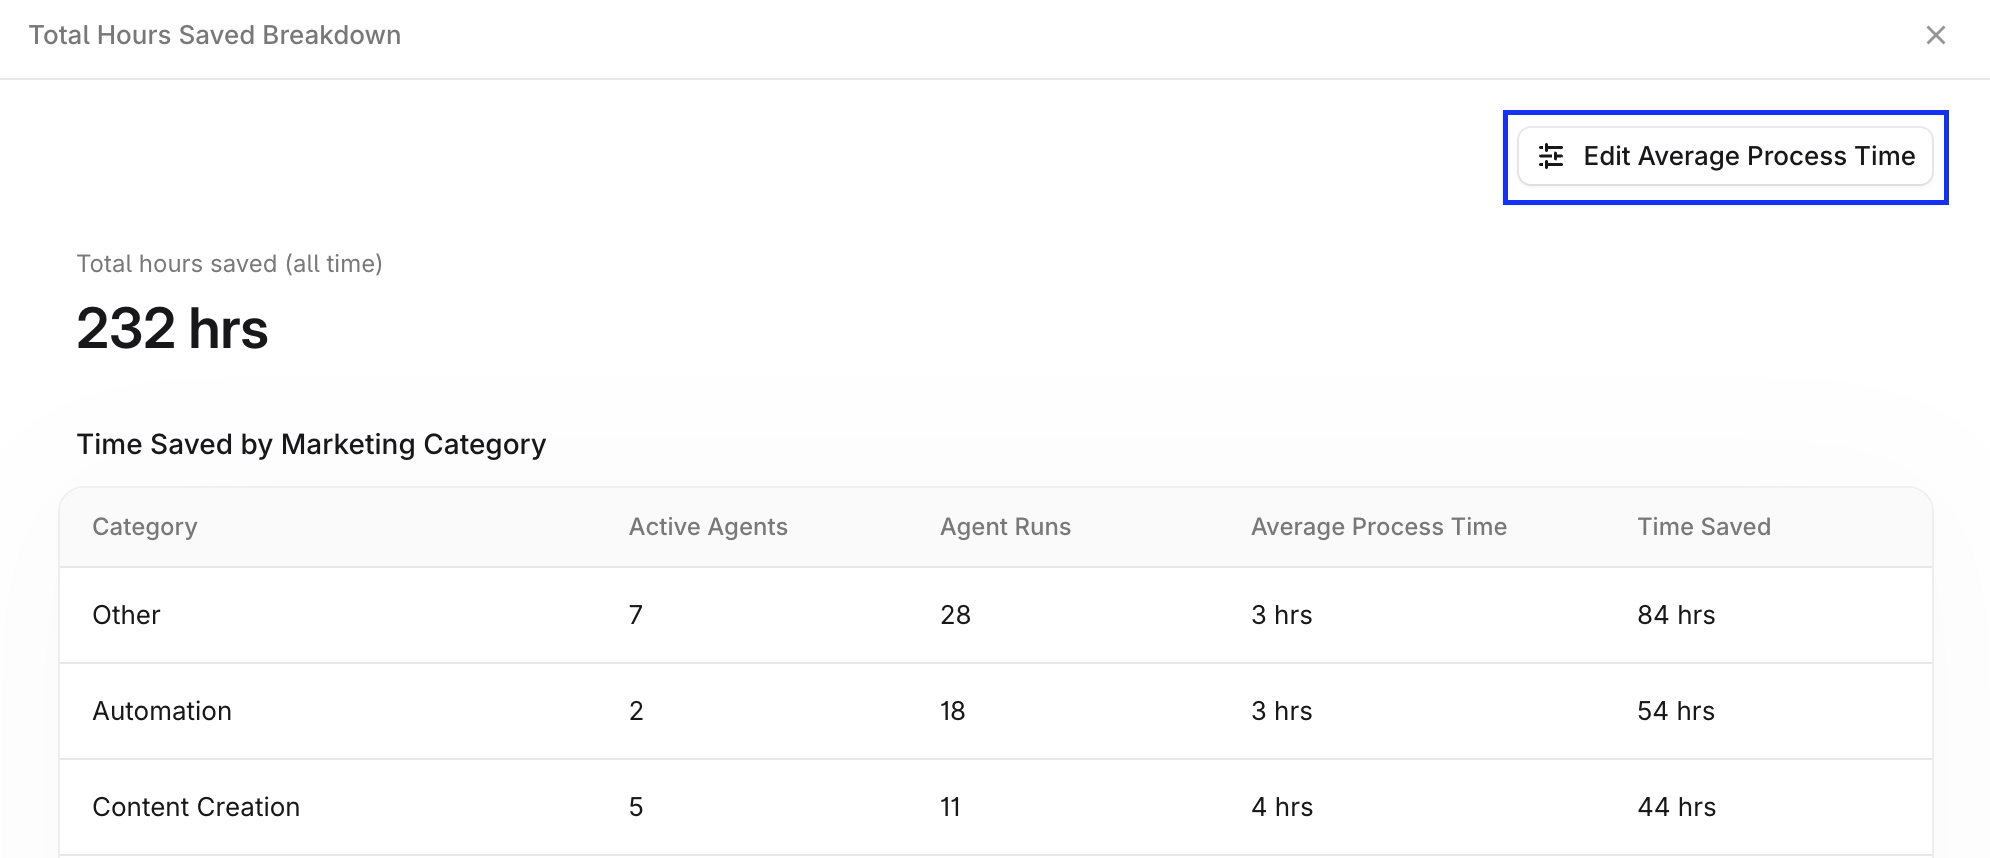
Adjust the hours per category so the hours saved figure reflects how long these tasks take your team.
Step 4: Set your benchmark
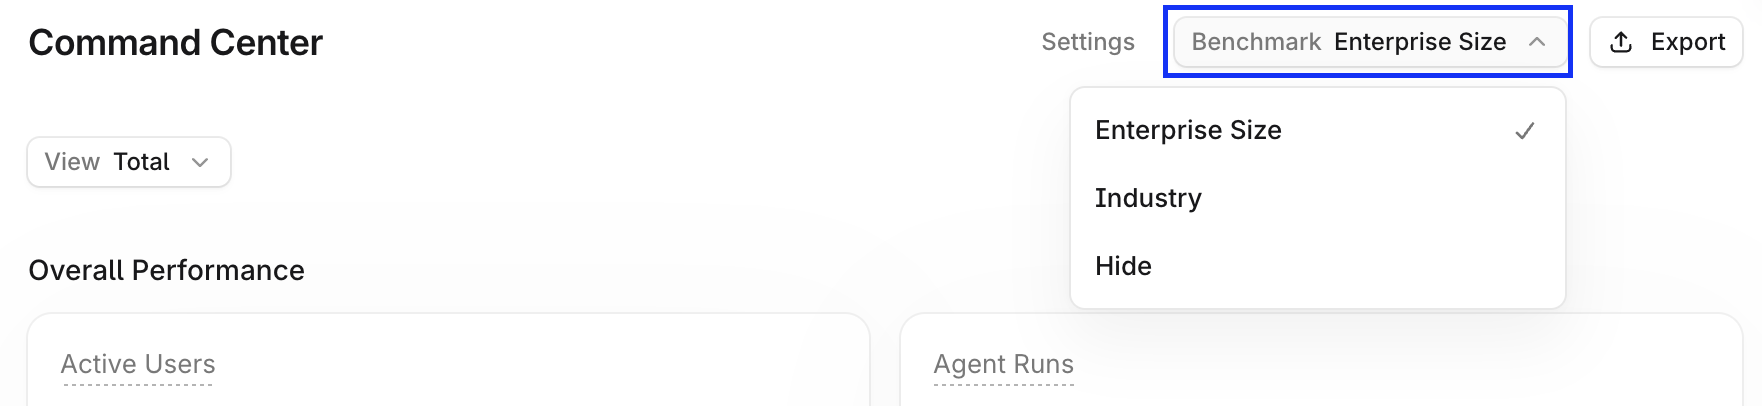
Use the Benchmark filter to compare your metrics by Enterprise Size or Industry. Select Hide if you want to view your numbers without the comparison.
Step 5: Export and share
Select Export to download the dashboard, or download the Power Users ranking (Power Users > View all users) to share adoption highlights with your team.