About Dashboards
Last updated: September 3, 2026
Available on: all plans
Find it in: Analytics > Dashboards
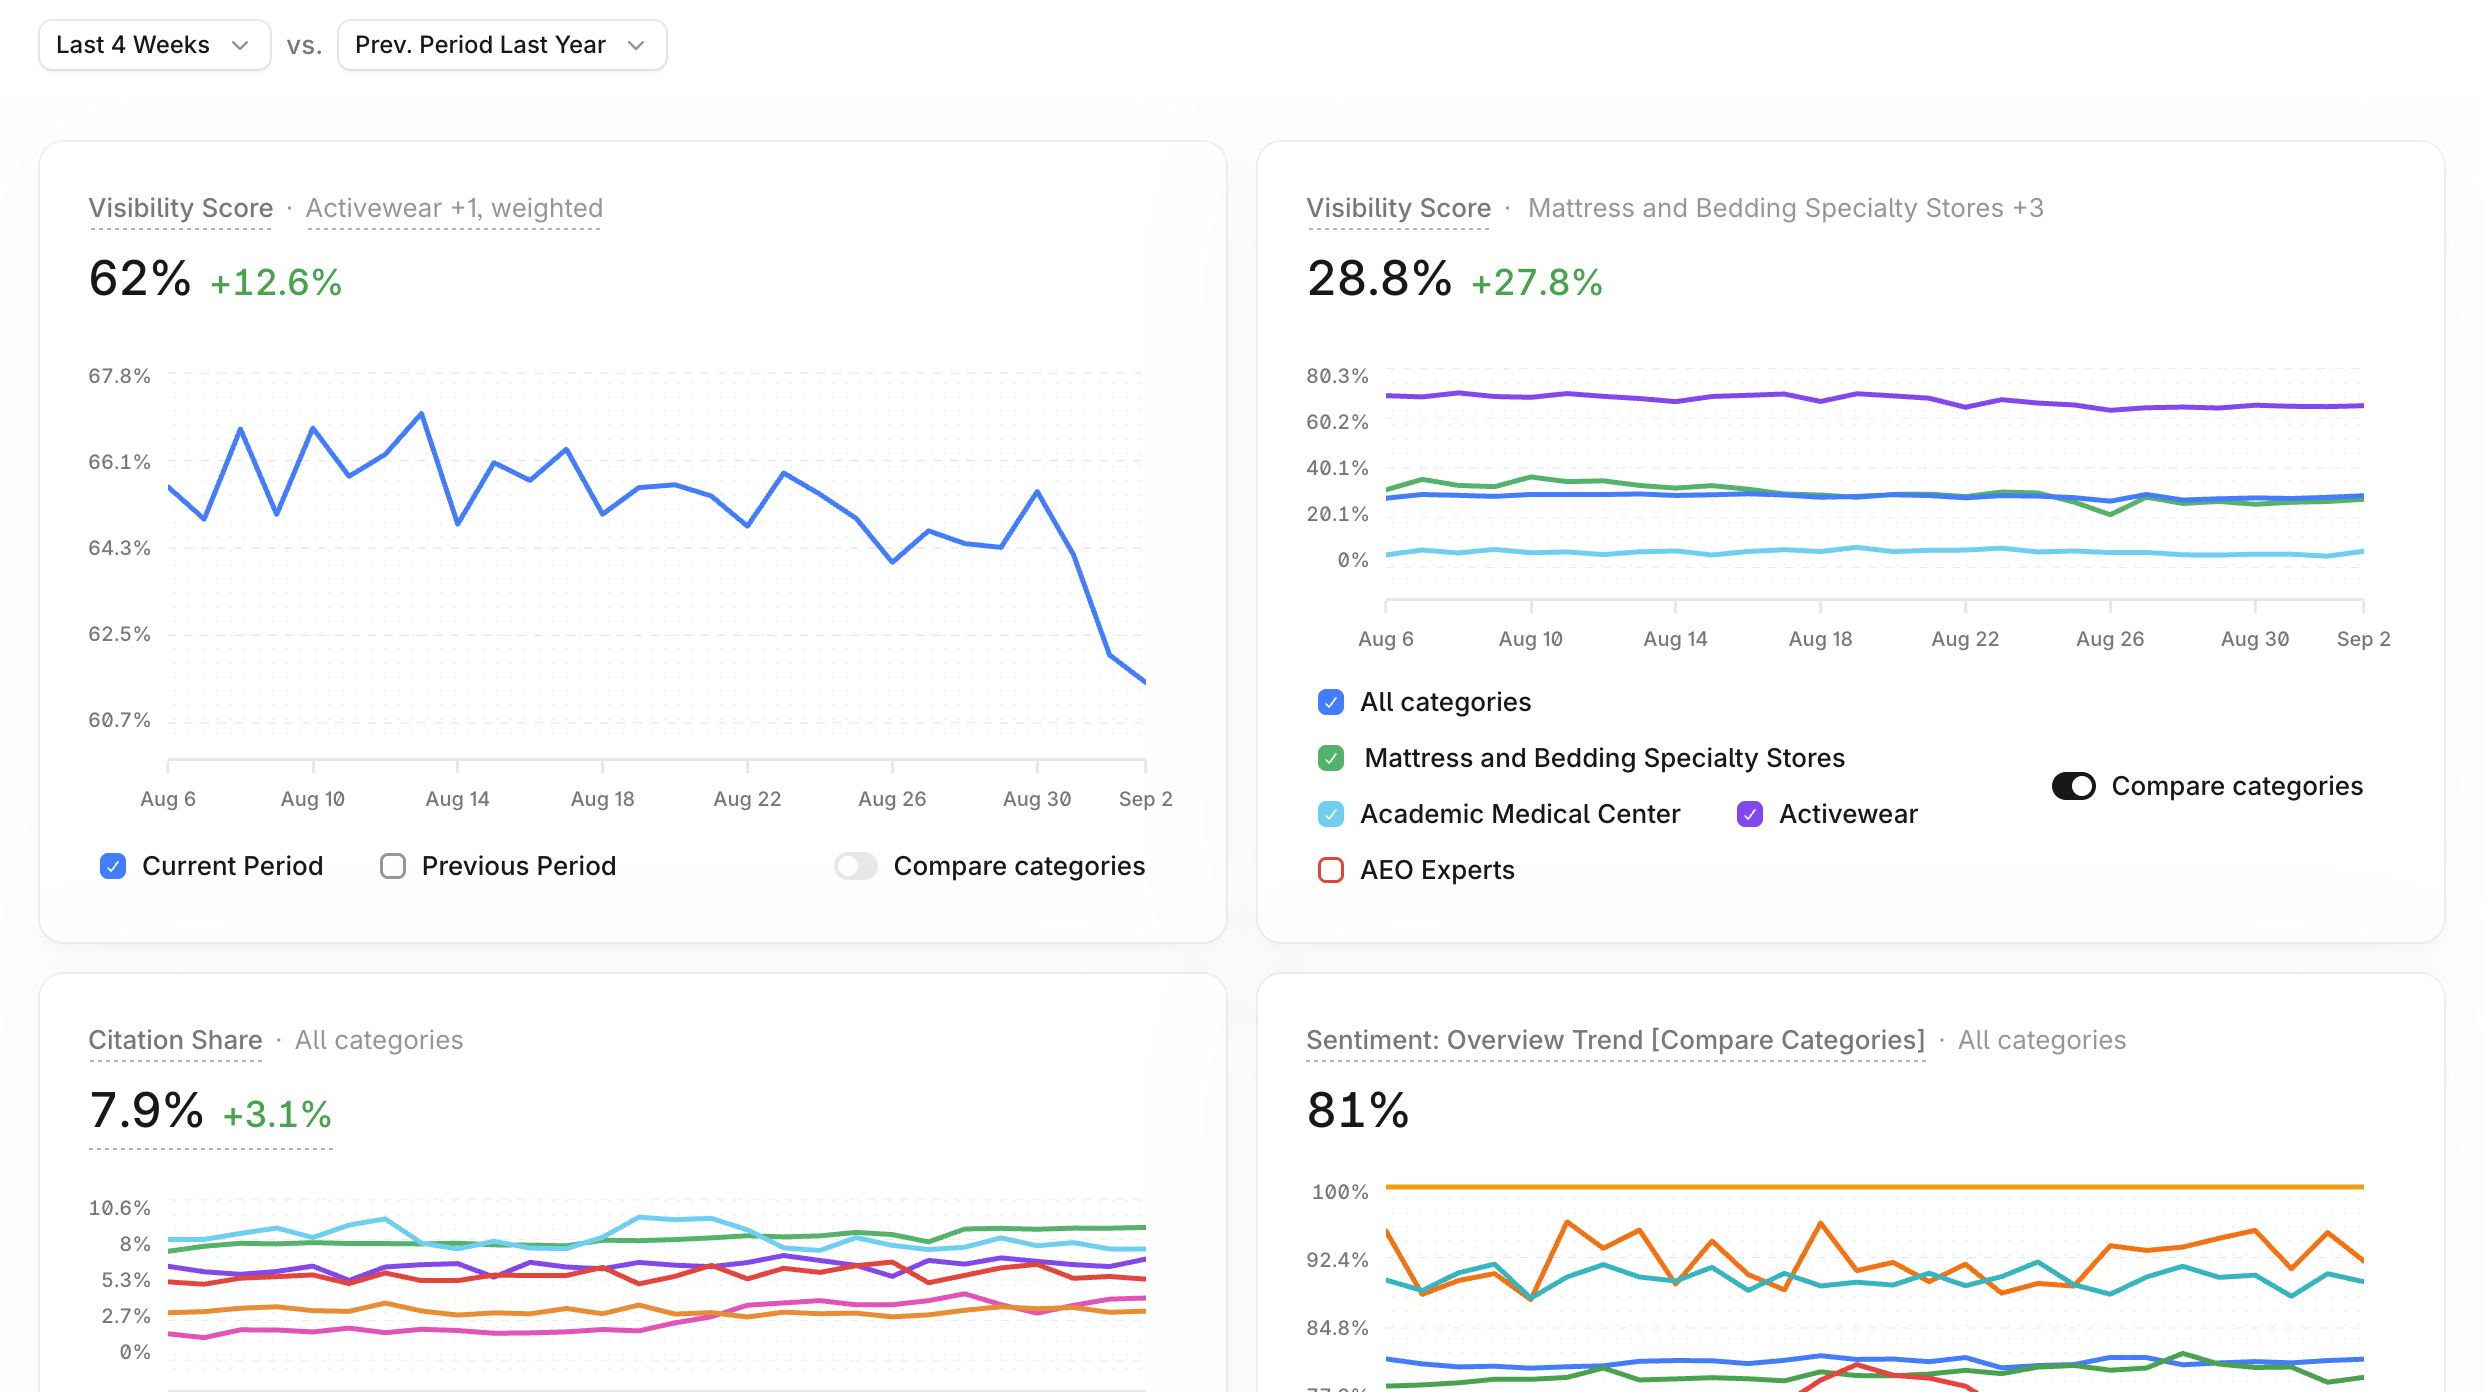
Custom Dashboards let you build configurable views of your Profound data and return to them any time, set up as you left them. Pick the charts that matter to you, apply filters, arrange the layout, and your reporting is ready whenever you or your stakeholders need it.
Key features
Configurable visualizations
Choose from Profound metrics such as Visibility Score, Share of Voice, and Citation Share, with more available across Sentiment, FactCheck, Shopping, and Agent Analytics. Display each visualization as a chart or a table, and add as many as you need.
Persistent filters
Narrow each visualization with filters such as Topics, Regions, and Competitors, with additional filters available for specific metrics. Filters are saved with each visualization, so the dashboard opens with them applied in your next session.
Sharing and privacy
Every dashboard starts private, visible only to people you invite. Invite specific people by email, open access to everyone in your organization, or set access to anyone with the link and share it with stakeholders outside Profound.
People in your organization who open a shared dashboard can change the date range for their own session, export it as a PDF, and duplicate it. Only the owner can edit visualizations or rename, share, or delete the dashboard. Link viewers outside Profound see a read-only dashboard fixed to the date range the owner saved.
PDF export
Export any dashboard as a PDF directly from Profound. One click produces a clean document you can attach to an email or drop into a monthly report.