Interpret Answer Engine Insights
Last updated: September 15, 2026
This article explains how to interpret Answer Engine Insights (AEI) with the original design. If AEI looks different in your Profound platform, see 📄 Interpret Answer Engine Insights v2.
Answer Engine Insights (AEI) breaks down your brand’s performance across several analytical dimensions. Add depth to your analysis by using the following Profound data views within Answer Engine Insights:
Visibility
Regions
Citations
Platforms
Sentiment
Filters
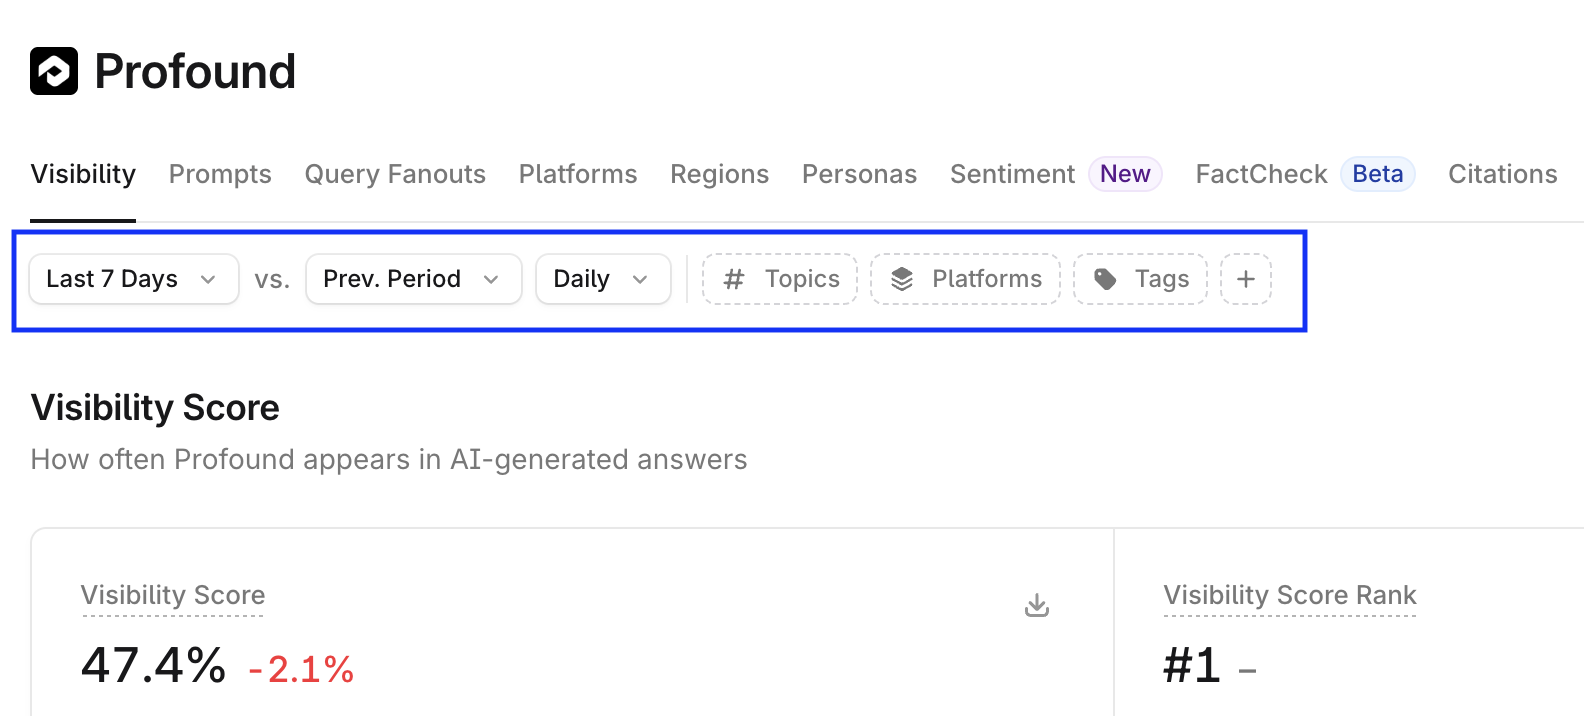
Filters are available throughout Answer Engine Insights. They allow you to adjust the analytical time frame, narrow the data view, and apply groupings. Filters appear as dropdown menus located beneath the top navigation bar.
Date range filter
Use the date range filter to select the time window of the answer engine response collection. You can choose a preset window (such as the previous 7 days) or define a custom range using the calendar selector.
After selecting a time frame, only answer engine responses generated during that period will appear in the Answer Engine Insights charts.
Charts display differences by calculating the change between the selected time frame and a previous period. You can adjust this comparison period using the Prev. Period dropdown
Attribute filters
Several attribute filters let you narrow chart data. While each chart includes filters relevant to its context, filter functionality is consistent across charts.
To adjust filters, open the dropdown for the desired attribute (Topics, Platforms, and so on) and select any attribute group you wish to include in the chart view.
Visibility
The Visibility tab in Answer Engine Insights breaks down your brand’s visibility across answer engine responses.
Visibility Score
Visibility Score is displayed as both a chart and a rankings table.
The chart shows either a line graph (day-to-day score changes) or a bar chart (performance against competitors).
The rankings table displays your brand’s rank by score relative to competitors
Is there an overall Visibility Score across platforms?
Yes. The main Visibility Score shown in Answer Engine Insights is your overall score for the currently selected filters and date range. The platform view is a breakdown of that performance by answer engine, not a separate replacement metric.
Use the overall Visibility Score to track broad performance trends over time. Use the platform breakdown to diagnose where the trend is coming from and which answer engines may need different optimization work.
How branded vs. non-branded prompts affect Visibility Score
Profound’s current Visibility Score in Answer Engine Insights is calculated from non-branded prompts, not from a combined set of branded and non-branded prompts.
If you review branded prompts separately, treat that as a narrower slice of prompt performance rather than the basis of the overall Visibility Score.
Can I measure total opportunity across all responses, even when no brand is mentioned?
Not directly in the current Answer Engine Insights UI.
Two existing metrics are useful here, but they answer different questions:
Visibility Score tells you how often your brand appeared in the selected result set.
Mention Frequency tells you how many times your brand was mentioned across the selected responses.
Neither metric currently exposes a native “total opportunity” view where the denominator is all responses in the selected prompt set regardless of whether any brand was mentioned.
If you need that broader denominator today, treat it as a manual or assisted analysis workflow rather than a built-in dashboard metric. In practice, that means reviewing the selected prompt set outside the standard Visibility Score readout and calculating the comparison against all responses collected for that slice.
If your goal is to understand broad category coverage rather than only brand appearances, use Visibility Score and Mention Frequency as directional signals, but do not treat them as a direct substitute for an “all responses” opportunity metric.
Share of Voice
Share of Voice is displayed as both a chart and a rankings table.
The chart shows either a line graph (day-to-day changes in share of voice) or a donut chart (percentage share compared to competitors).
The rankings table shows your brand’s rank by share of voice relative to competitors
Visibility Rankings by Topic
Visibility Rankings by Topic table shows your brand’s rankings across specific topics.
Further prompt analysis is available by expanding a topic, and looking at the prompts categorized within that topic. Rankings are available for both the topic aggregation, as well as the individual prompts within that topic.
Regions
The Regions tab in Answer Engine Insights analyzes your brand’s regional visibility through answer engine responses.
Regional analysis is available as a line chart broken down by selected regions, or a world heat map. Both serve as visualizations of your brand’s visibility across different countries.
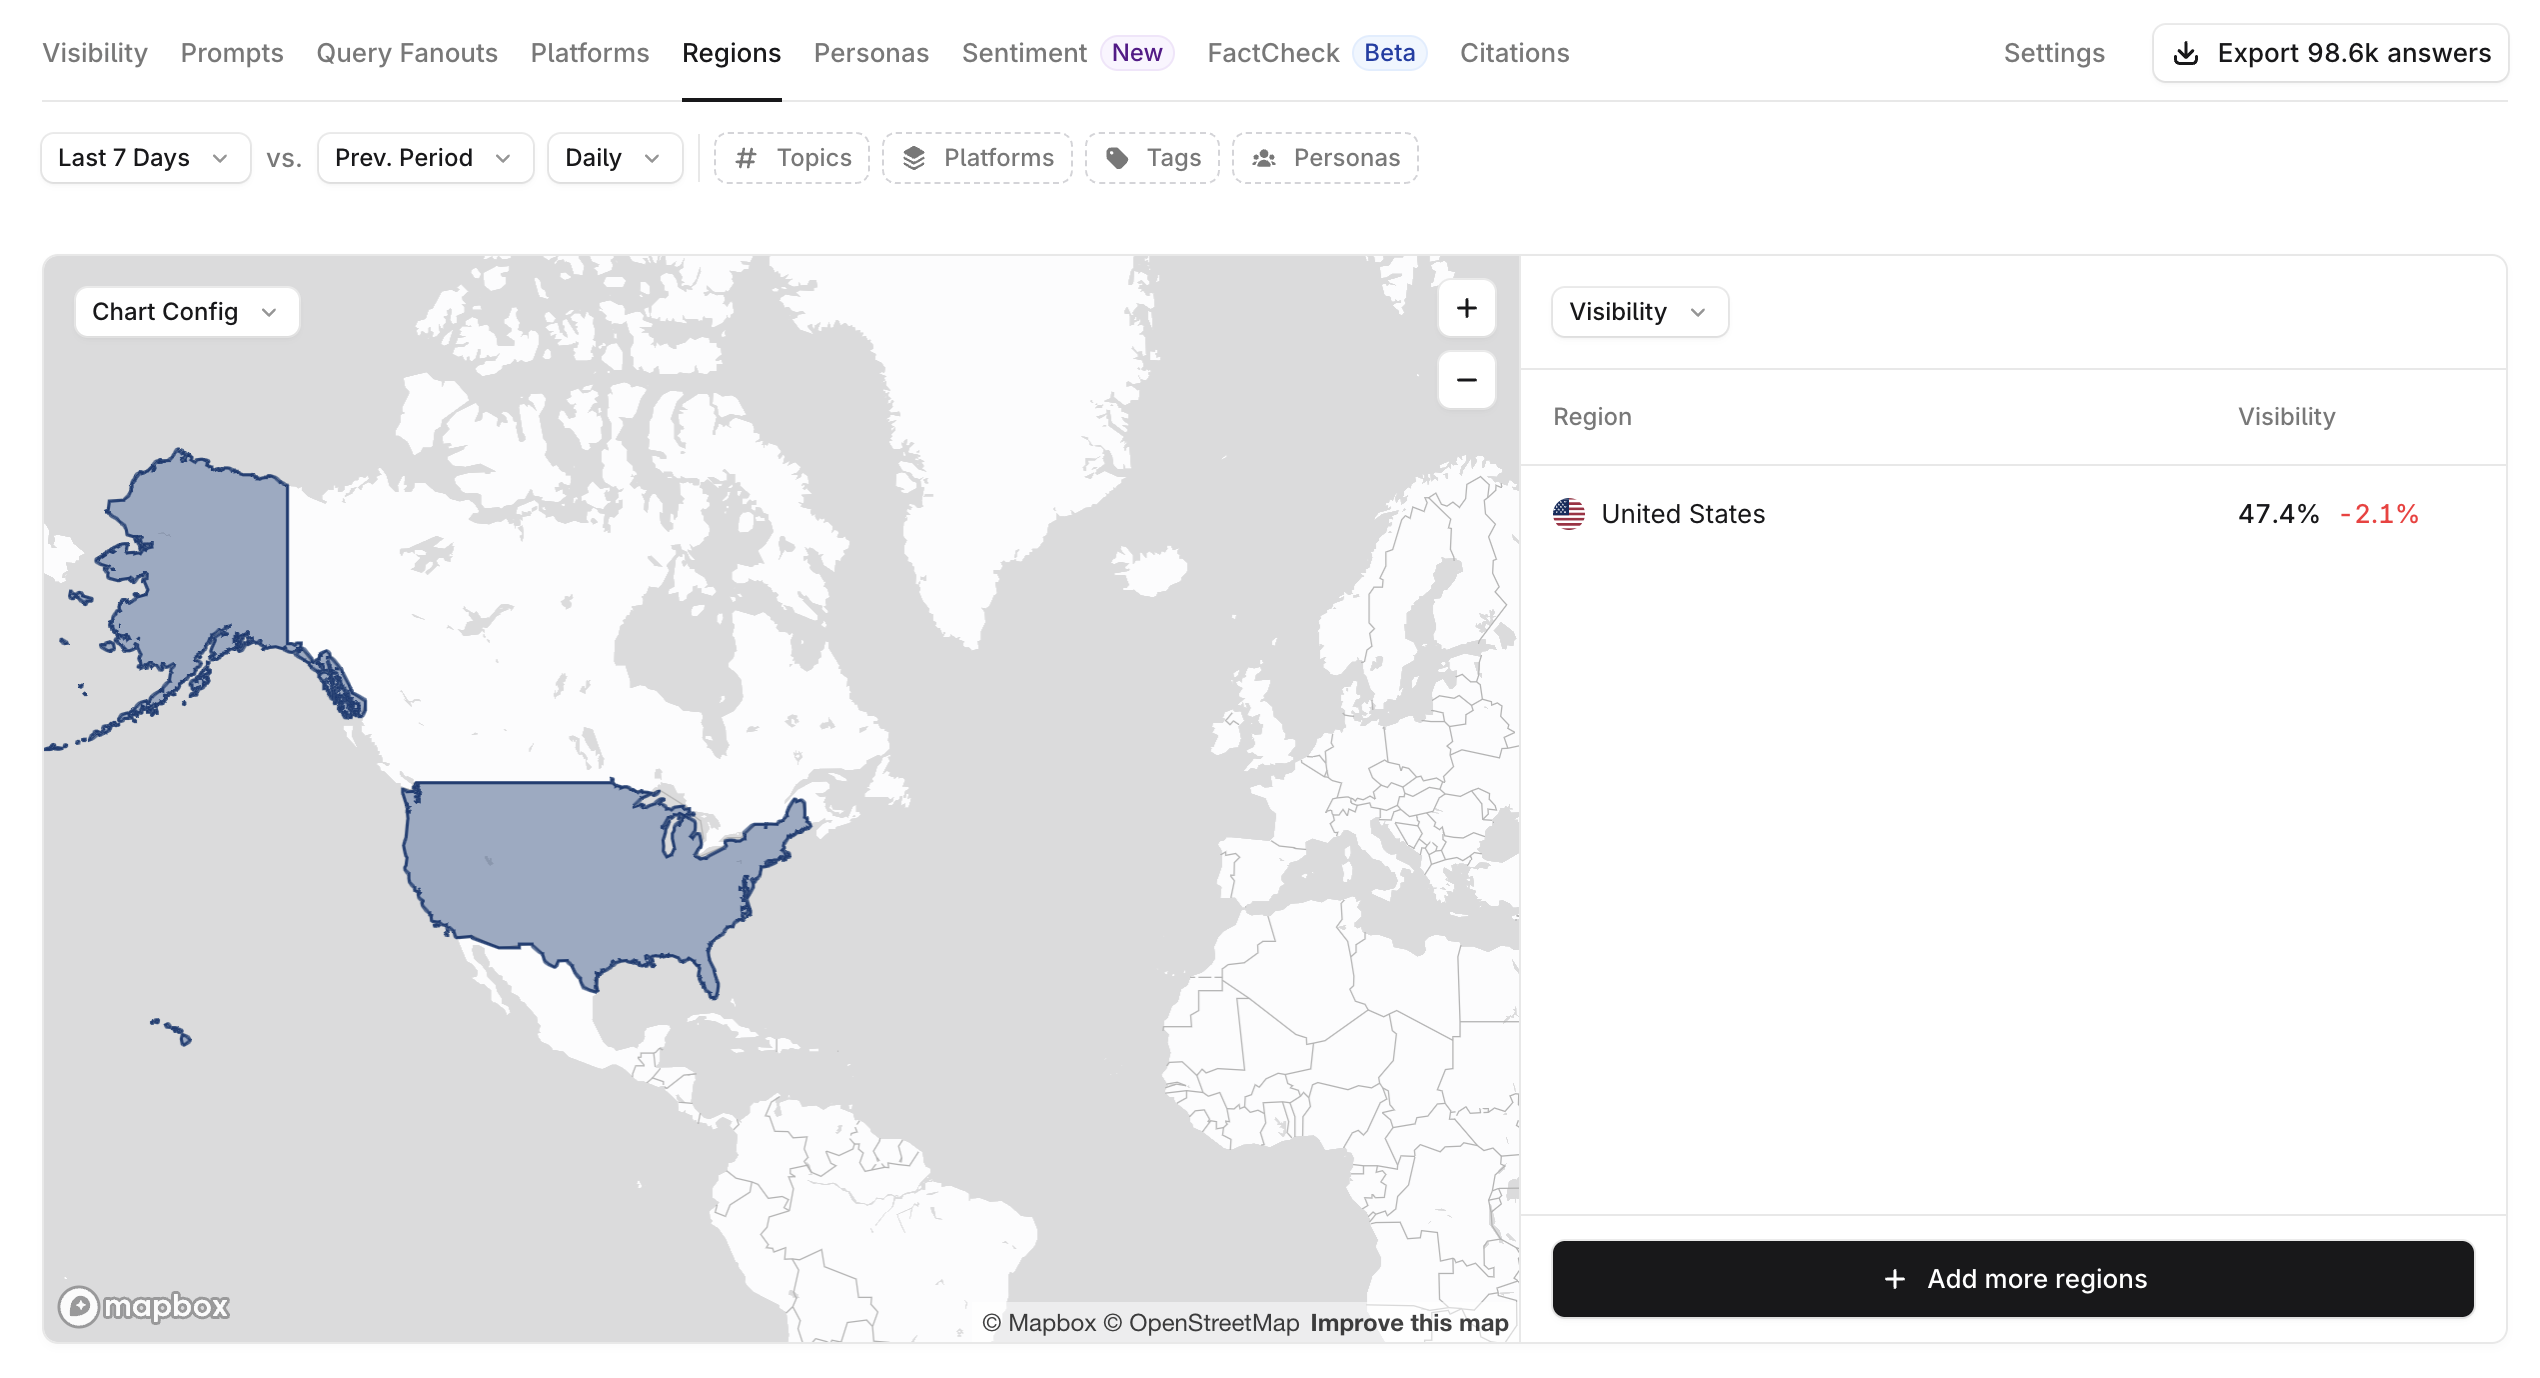
Select + Add more regions to request that additional countries be included in the analysis.
Citations
The Citation tab in Answer Engine Insights assesses the prevalence of citations from your domains in answer engine responses.
Citation Share
Citation Share is displayed as both a chart and a rankings table.
The chart shows either a line graph (day-to-day changes in citation share) or a donut chart (percentage share compared to competitors).
When to use visibility vs. citation share
Use Visibility when your main question is whether a brand or source appeared at all in an answer. Visibility is best for measuring coverage across prompts, models, or regions because it answers a binary question: did the brand show up or not?
Use Citation Share when your main question is how often a source was cited relative to all other citations in the selected result set. Citation Share is better for analyzing distribution among sources after a citation was made.
A sudden drop in Citation Share does not always mean the source stopped influencing retrieval. It can also mean the answer engine is still querying that source but citing it less often in the final answer.
How to interpret fanout and regional citation changes
If a source's citations fall sharply after an answer engine update, compare the citation trend with fanout behavior and regional breakdowns before concluding the source stopped mattering.
If site-named or source-specific fanouts increase while citations fall, the source may still be part of retrieval even though it is being cited less often in final answers.
If the drop appears across many regions at once, that usually points to answer-engine behavior changing systemically rather than the source becoming less relevant in one country.
If only one or two regions change, review prompt phrasing, market-specific results, and sample size before treating it as a broad platform shift.
For day-over-day investigations, start with Visibility to confirm where the source still appears, then use Citation Share to measure how the remaining citations are distributed.
How to investigate a Reddit citation drop or a Reddit insights report with too little data
If a Reddit-focused report suddenly has too little citation or thread data to generate insights, do not assume Profound stopped collecting Reddit data or that you need to pause reporting immediately.
First compare the current period against the prior period in Answer Engine Insights > Citations using the same filters. Check whether Reddit citations fell broadly or only for specific topics, prompts, or regions.
Review Top Citation Domains, Top Citation Pages, and platform or topic filters to see which sources are appearing in Reddit’s place.
If the goal is to understand impact rather than only count Reddit citations, use an AI Marketer workflow or equivalent prompt-level analysis to identify which prompts lost Reddit citations, what sources replaced them, and whether visibility or competitive positioning changed in a meaningful way.
Treat this pattern as an answer-engine citation behavior shift first unless you also see blank results, missing response collection, or other signs of a Profound data issue.
In practice, the best interim workflow is usually to keep reporting, but change the analysis question: instead of asking only whether Reddit was cited, analyze where Reddit citations dropped, what replaced them, and whether that changed the brand’s visibility or competitive landscape.
There may not be a direct product-side fix inside Profound when the answer engine itself is citing Reddit less often. In those cases, use the report as a signal about ecosystem behavior and supplement it with prompt-level source analysis instead of waiting for citation patterns to “stabilize.”
How to interpret Google AI Mode citation shifts after link-routing changes
Google AI Mode can change how it routes, displays, or attributes citations without any change to your Profound setup. When Google shifts more clicks or visible citations toward google.com or other Google-owned surfaces, your brand's direct citation share can fall even if AI Mode usage or overall answer volume rises.
If AI Mode activity increases while owned-site citation share decreases, do not assume Profound stopped collecting data. First check whether Google is surfacing more Google-owned destinations such as Business Profiles, Product Knowledge Panels, or Google-hosted result pages.
Use Visibility alongside Citation Share. A drop in citation share with stable visibility usually means answer presentation changed, not that your brand disappeared from retrieval.
Review Top Citation Domains, Top Citation Pages, and relevant regional/platform filters to confirm whether Google-owned properties are taking a larger share of visible citations.
Treat short-term movement around major Google changes as an ecosystem shift first. Escalate to support if the pattern looks like missing response collection, blank data, or a platform-specific outage rather than a redistribution of visible citations.
There is not always a direct workaround for these Google changes inside Profound. In those cases, the most practical next step is to analyze which Google-owned entities are now being cited and improve the completeness and competitiveness of those surfaces alongside your owned pages.
Citation Categories
Citation Categories classify the sources AI platforms cite, helping you understand where your visibility comes from and identify opportunities.
Owned, Competition, and Custom categories are defined by you in Answer Engine Insights > Settings > Citation Categories. All other categories are assigned automatically but can be overridden in settings.
Category | Definition | Includes |
Owned | Websites and digital properties directly owned, controlled, or managed by your brand or its related entities. | Primary domains, subdomains, product microsites, help centers, documentation sites |
Competition | Websites belonging to or controlled by competitors your brand tracks. | Competitor homepages, blogs, press sections, resource pages |
Earned Media | Sites whose primary purpose is publishing content. A marketer can identify a site owner, editor, or publisher to partner with. Content is the product, monetized via ads, affiliate revenue, or subscriptions. Does not include corporate blogs, company newsrooms, or lead generation sites. | News outlets, magazines, trade publications, editorial review sites (Wirecutter, PCMag), affiliate/comparison sites (NerdWallet, Investopedia), broadcast media, contributor-model publications (Forbes, HuffPost), personal blogs |
PR Wire | Press release distribution services that syndicate company announcements to media outlets. | PR Newswire, Business Wire, GlobeNewswire, Accesswire, and other major PR wires |
Institution | Government, educational, research, or public-interest nonprofit organizations. Institutional TLDs are auto-classified: .gov, .edu, .mil, .int, .gov., .ac., .nhs., .gouv., .gob.* | Government sites, universities, research institutions, academic publishers (Nature, arXiv), international bodies (UN, WHO), professional associations (ABA, AMA), mission-driven nonprofits (Red Cross, UNICEF), Wikipedia |
Social | Platforms where users publish freely and visibility is determined by votes, algorithms, or follower graphs. Does not include vendor-owned support forums or e-commerce product reviews. | Social networks (Facebook, Instagram, X/Twitter, TikTok, LinkedIn), video platforms (YouTube), discussion platforms (Reddit, Discord), Q&A platforms (Quora, Stack Overflow), open publishing platforms (Medium, Substack), consumer review aggregators (Yelp, TripAdvisor), B2B review aggregators (G2, Capterra, TrustRadius) |
Other | Sources that don't fit the above categories, typically where content exists to support selling products or services. Domains with fewer than 100 total citations are also classified as Other. | Corporate websites, SaaS, e-commerce, service businesses, company blogs/newsrooms, vendor-owned forums, marketplaces (Airbnb, Etsy), course platforms (Coursera, Udemy), job boards, directories, industry trade groups, lead generation sites |
Custom | Categories you create to track specific domains or pages. | Any domains or pages you specify |
Top Citation Domains
Top Citation Domains is a ranked list of the most frequently cited domains in AI-generated responses.
Top Citation Pages
Top Citation Pages is a ranked list of the most referenced web pages in AI answers. Multiple pages from the same domain can appear in this list.
How to use Top Citation Pages as an action list
Use Top Citation Pages to understand which pages are shaping the answer engines’ view of your category and brand.
If your owned pages appear often, those pages may already be helping control the narrative. Review what formats, claims, and structures are working so you can reinforce them.
If competitor or third-party pages dominate, treat that as a content and distribution signal. Review what those pages cover, what questions they answer, and where your brand may need stronger content or additional earned placements.
If a page moves up quickly or becomes a new entrant, treat that as a cue to inspect the topic and source before the next reporting cycle.
In other words, this report can be both good to know and a call to action. The next step depends on who is being cited and whether those citations align with the story you want answer engines to tell.
Watched Pages
Watched Pages are specific URLs you choose to track for citation performance. While Top Citation Pages lists the most cited pages overall, Watched URLs allows you to define and monitor a custom set of URLs.
Citation Decay
Citation Decay helps you understand how long a cited page keeps its citation strength after it peaks.
Rise measures how long it took a page to go from its first citation to its peak.
Half-life is the best proxy for durability after a page has peaked. A longer half-life generally means the citation stayed relevant for longer; a shorter half-life means citations fell off more quickly.
If a page does not show a half-life yet, that often means it has not clearly begun declining. For a page that is still trending upward, no half-life can be a positive sign rather than a problem.
For pages that are still rising, focus on sustained citation growth, how long the page has been cited, and current citation volume. Use half-life once the page begins declining.
Citation Relationships
The Citation Relationships chart visualizes how citations are connected across answer engines and topics.
Clusters represent groups of cited sources that share mentions for a particular topic and platform. For example, if your brand is mentioned in two different publications that are both cited by AI answer engine platforms, those publications will appear in the same cluster.
Platforms
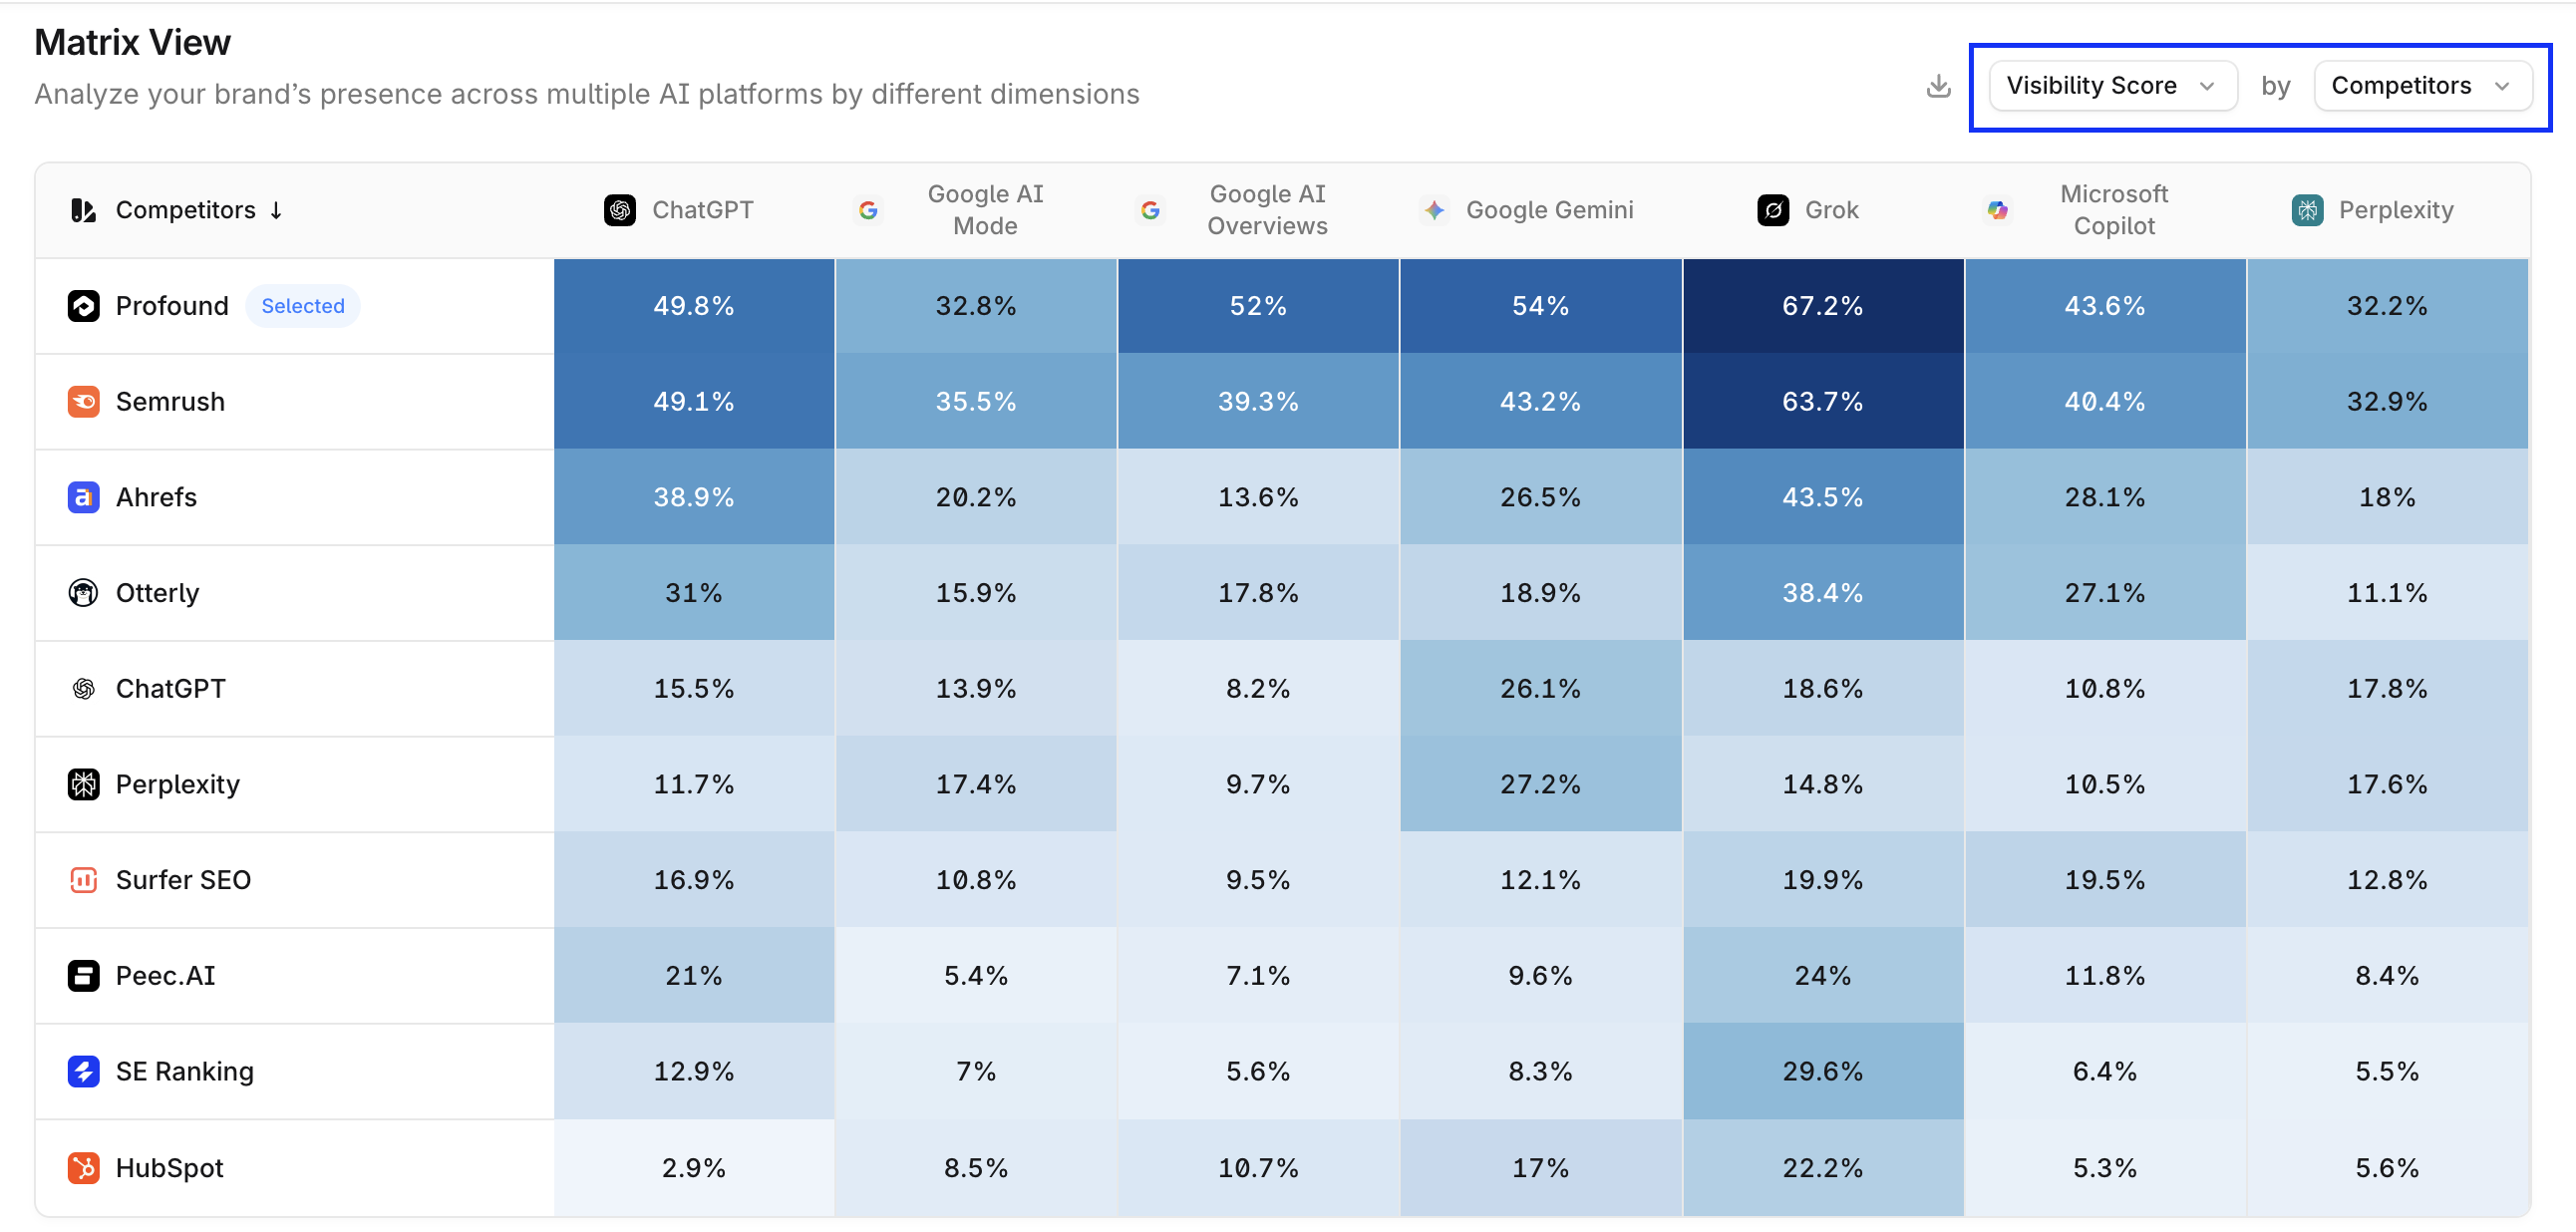
The Platforms tab dissects how your brand is represented across different answer engine tools. Metrics such as Visibility Score, Share of Voice, Citation Share, Sentiment, and Position are all broken down by platform performance.
Why compare platforms separately?
Different answer engines rely on different source mixes and ranking behaviors. A weak result on one platform can point to a specific content or source gap even when your overall performance looks stable.
For example, one platform may rely more heavily on editorial sources, while another may give more weight to video, community discussions, or live web results. That makes the platform view useful for diagnosing where to optimize rather than only whether visibility changed overall.
Platform-level analysis is also useful when some answer engines matter more to your team than others. Prioritize the platforms that are most relevant to your audience, use case, or reporting goals.
The Matrix View presents a tabular view of your brand’s Visibility, Share of Voice, or Citation Share across answer engines—compared to competitors, tags, or topics. You can adjust the displayed rows and values via the configuration dropdowns on the top right of the table.
Sentiment
The Sentiment tab in Answer Engine Insights assesses the tone in which your brand is mentioned by answer engines.
To learn more about how Sentiment works, see the 📄 📄 About Sentiment section.